Every company has big data in its future and every company will eventually be in the data business
DATA SCIENCE & ANALYTICS ROADMAP
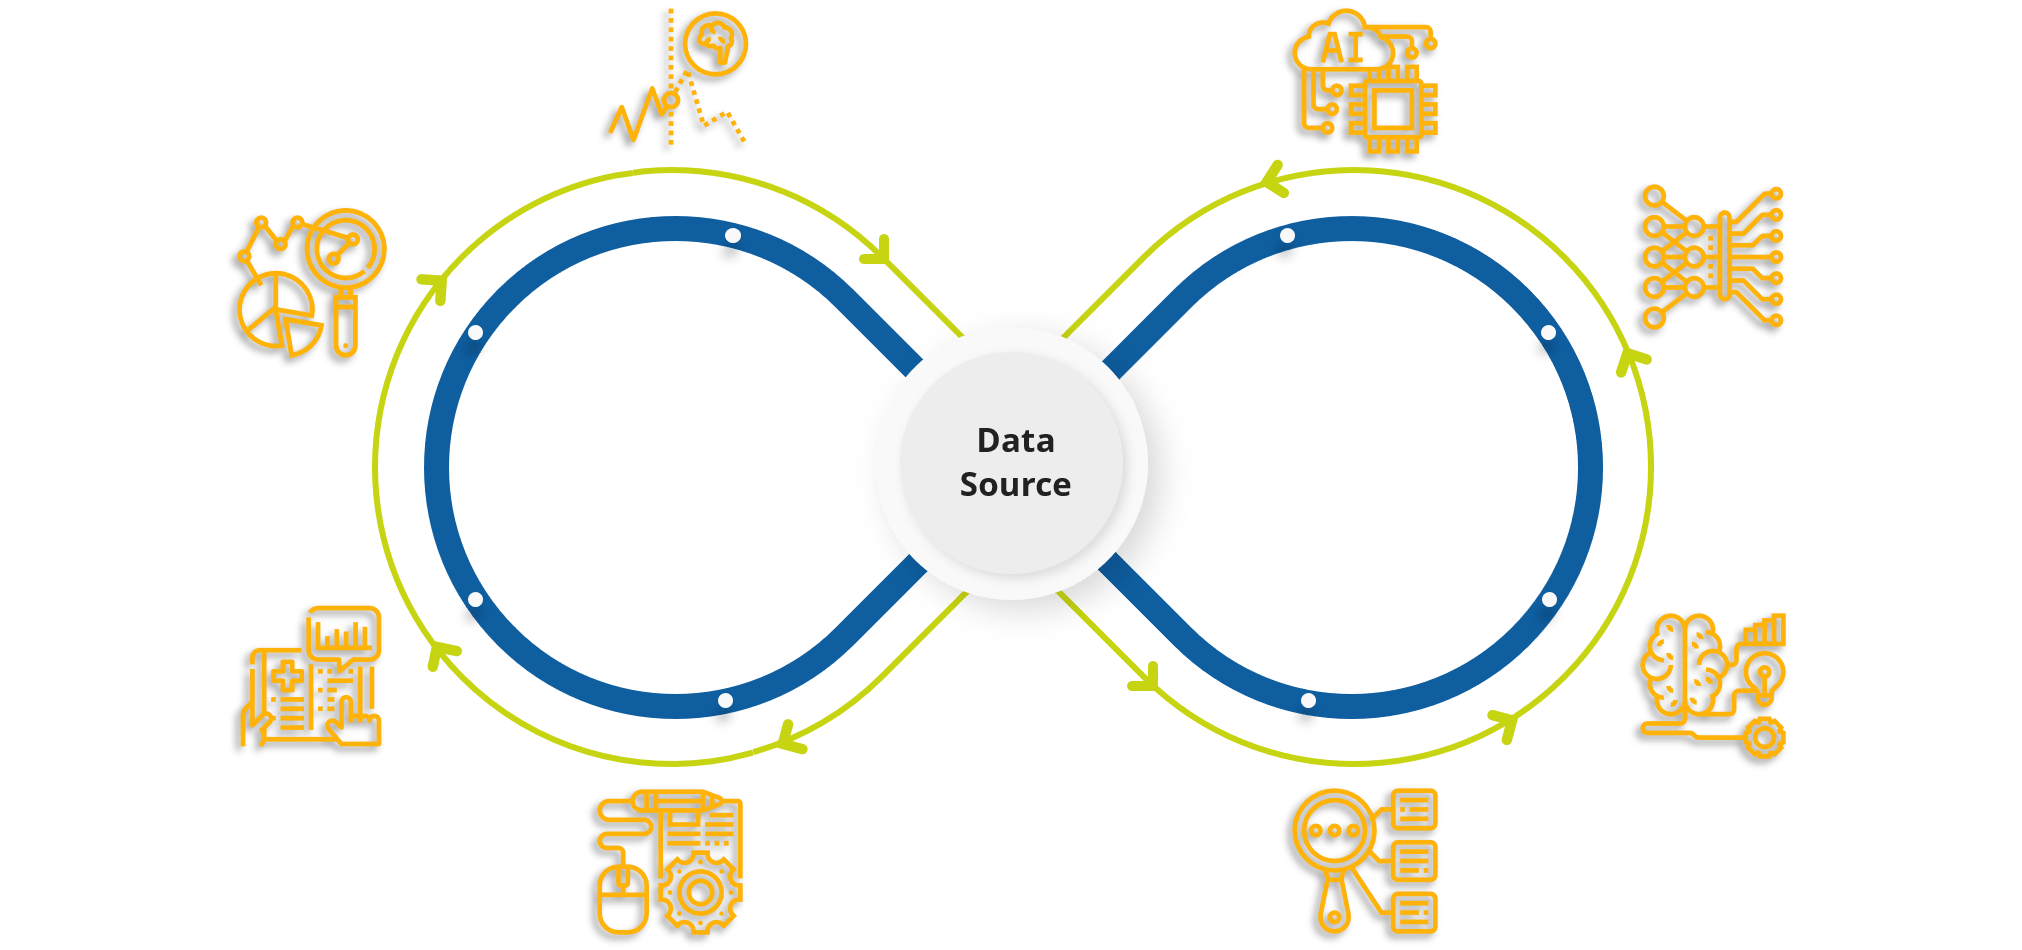
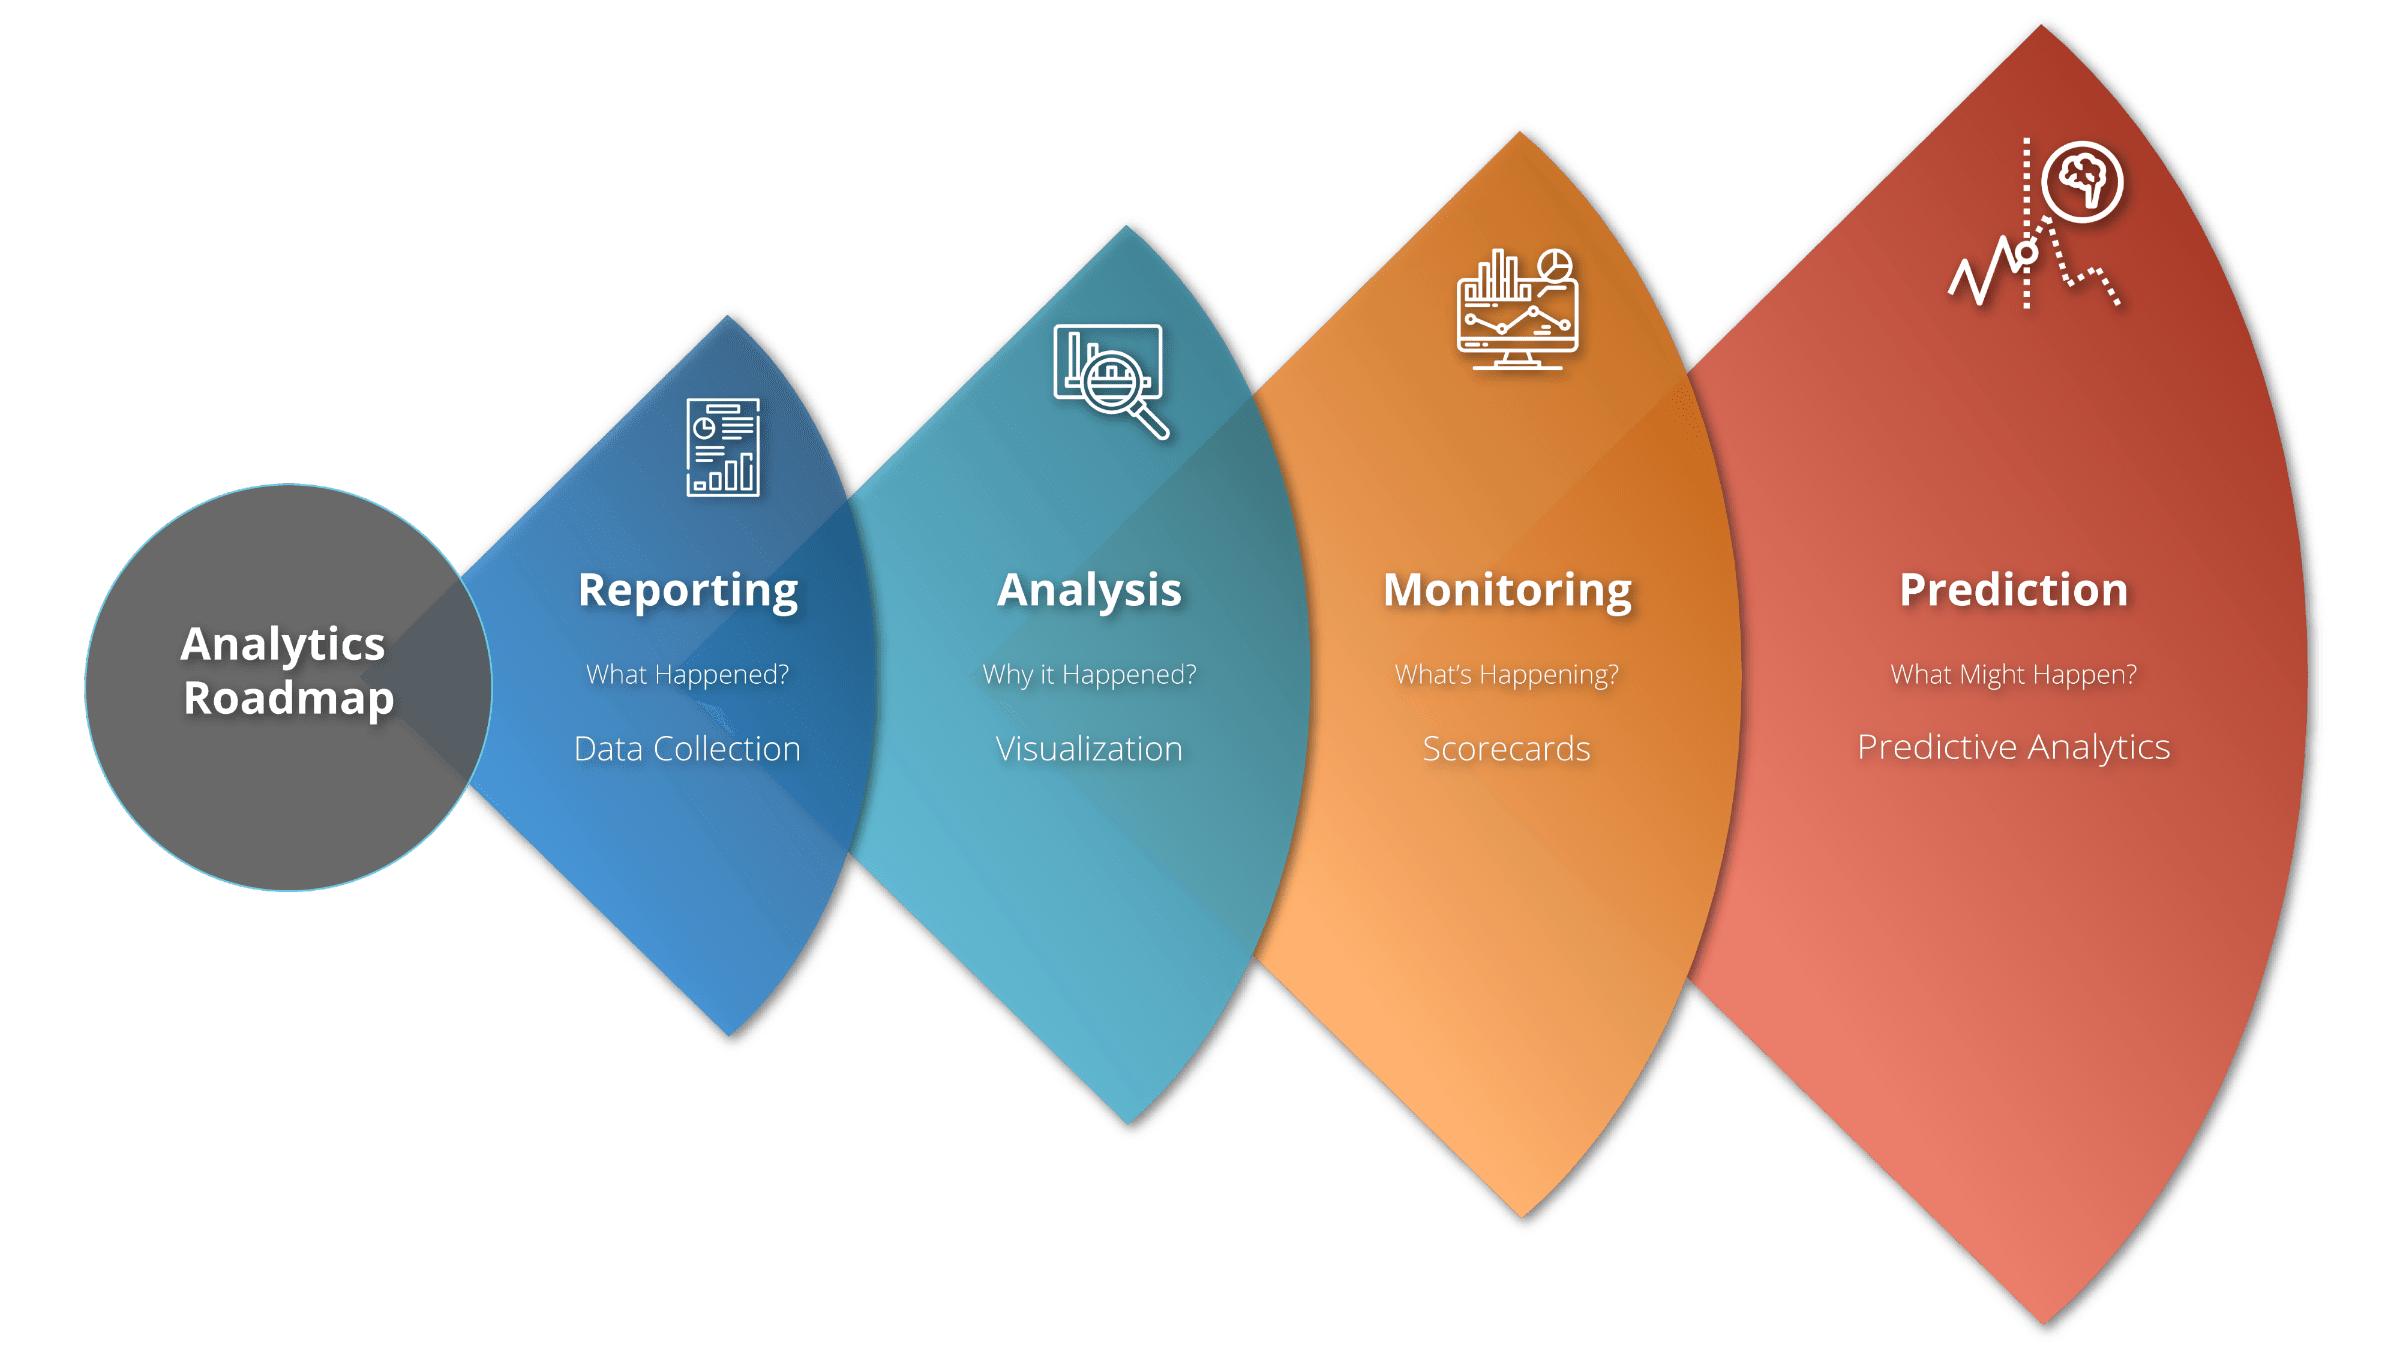
The analytics journey of any organization begins by diagnosing simple data points and visualizing the past performance. As the organizations mature, they move towards, predictive and prescriptive analytics which is powered by data science.
POWER OF PREDICTIVE ANALYTICS
OpenBI helps its customers come up the curve in every phase of their analytics maturity. With gradual understanding of the company culture and data dynamics, effective deployment strategies are cultivated which boosts the BI adoption across the organization.
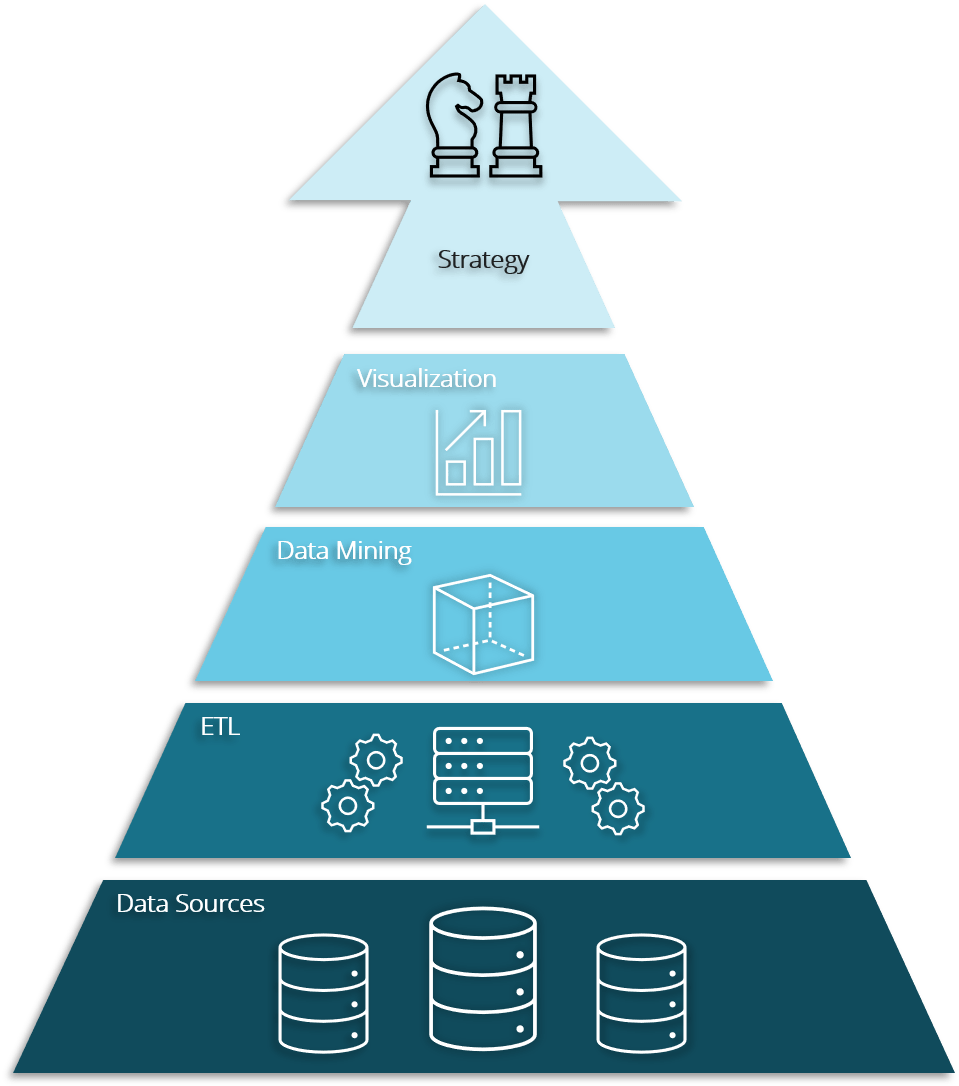
BUSINESS INTELLIGENCE MEETS DATA TECHNOLOGY
Connecting business thinking with data technology is the biggest challenge in successful adoption of data science & analytics. OpenBI is the bridge which understands business thinking as well as it understands the data technology to help its customers develop effective data driven strategies.
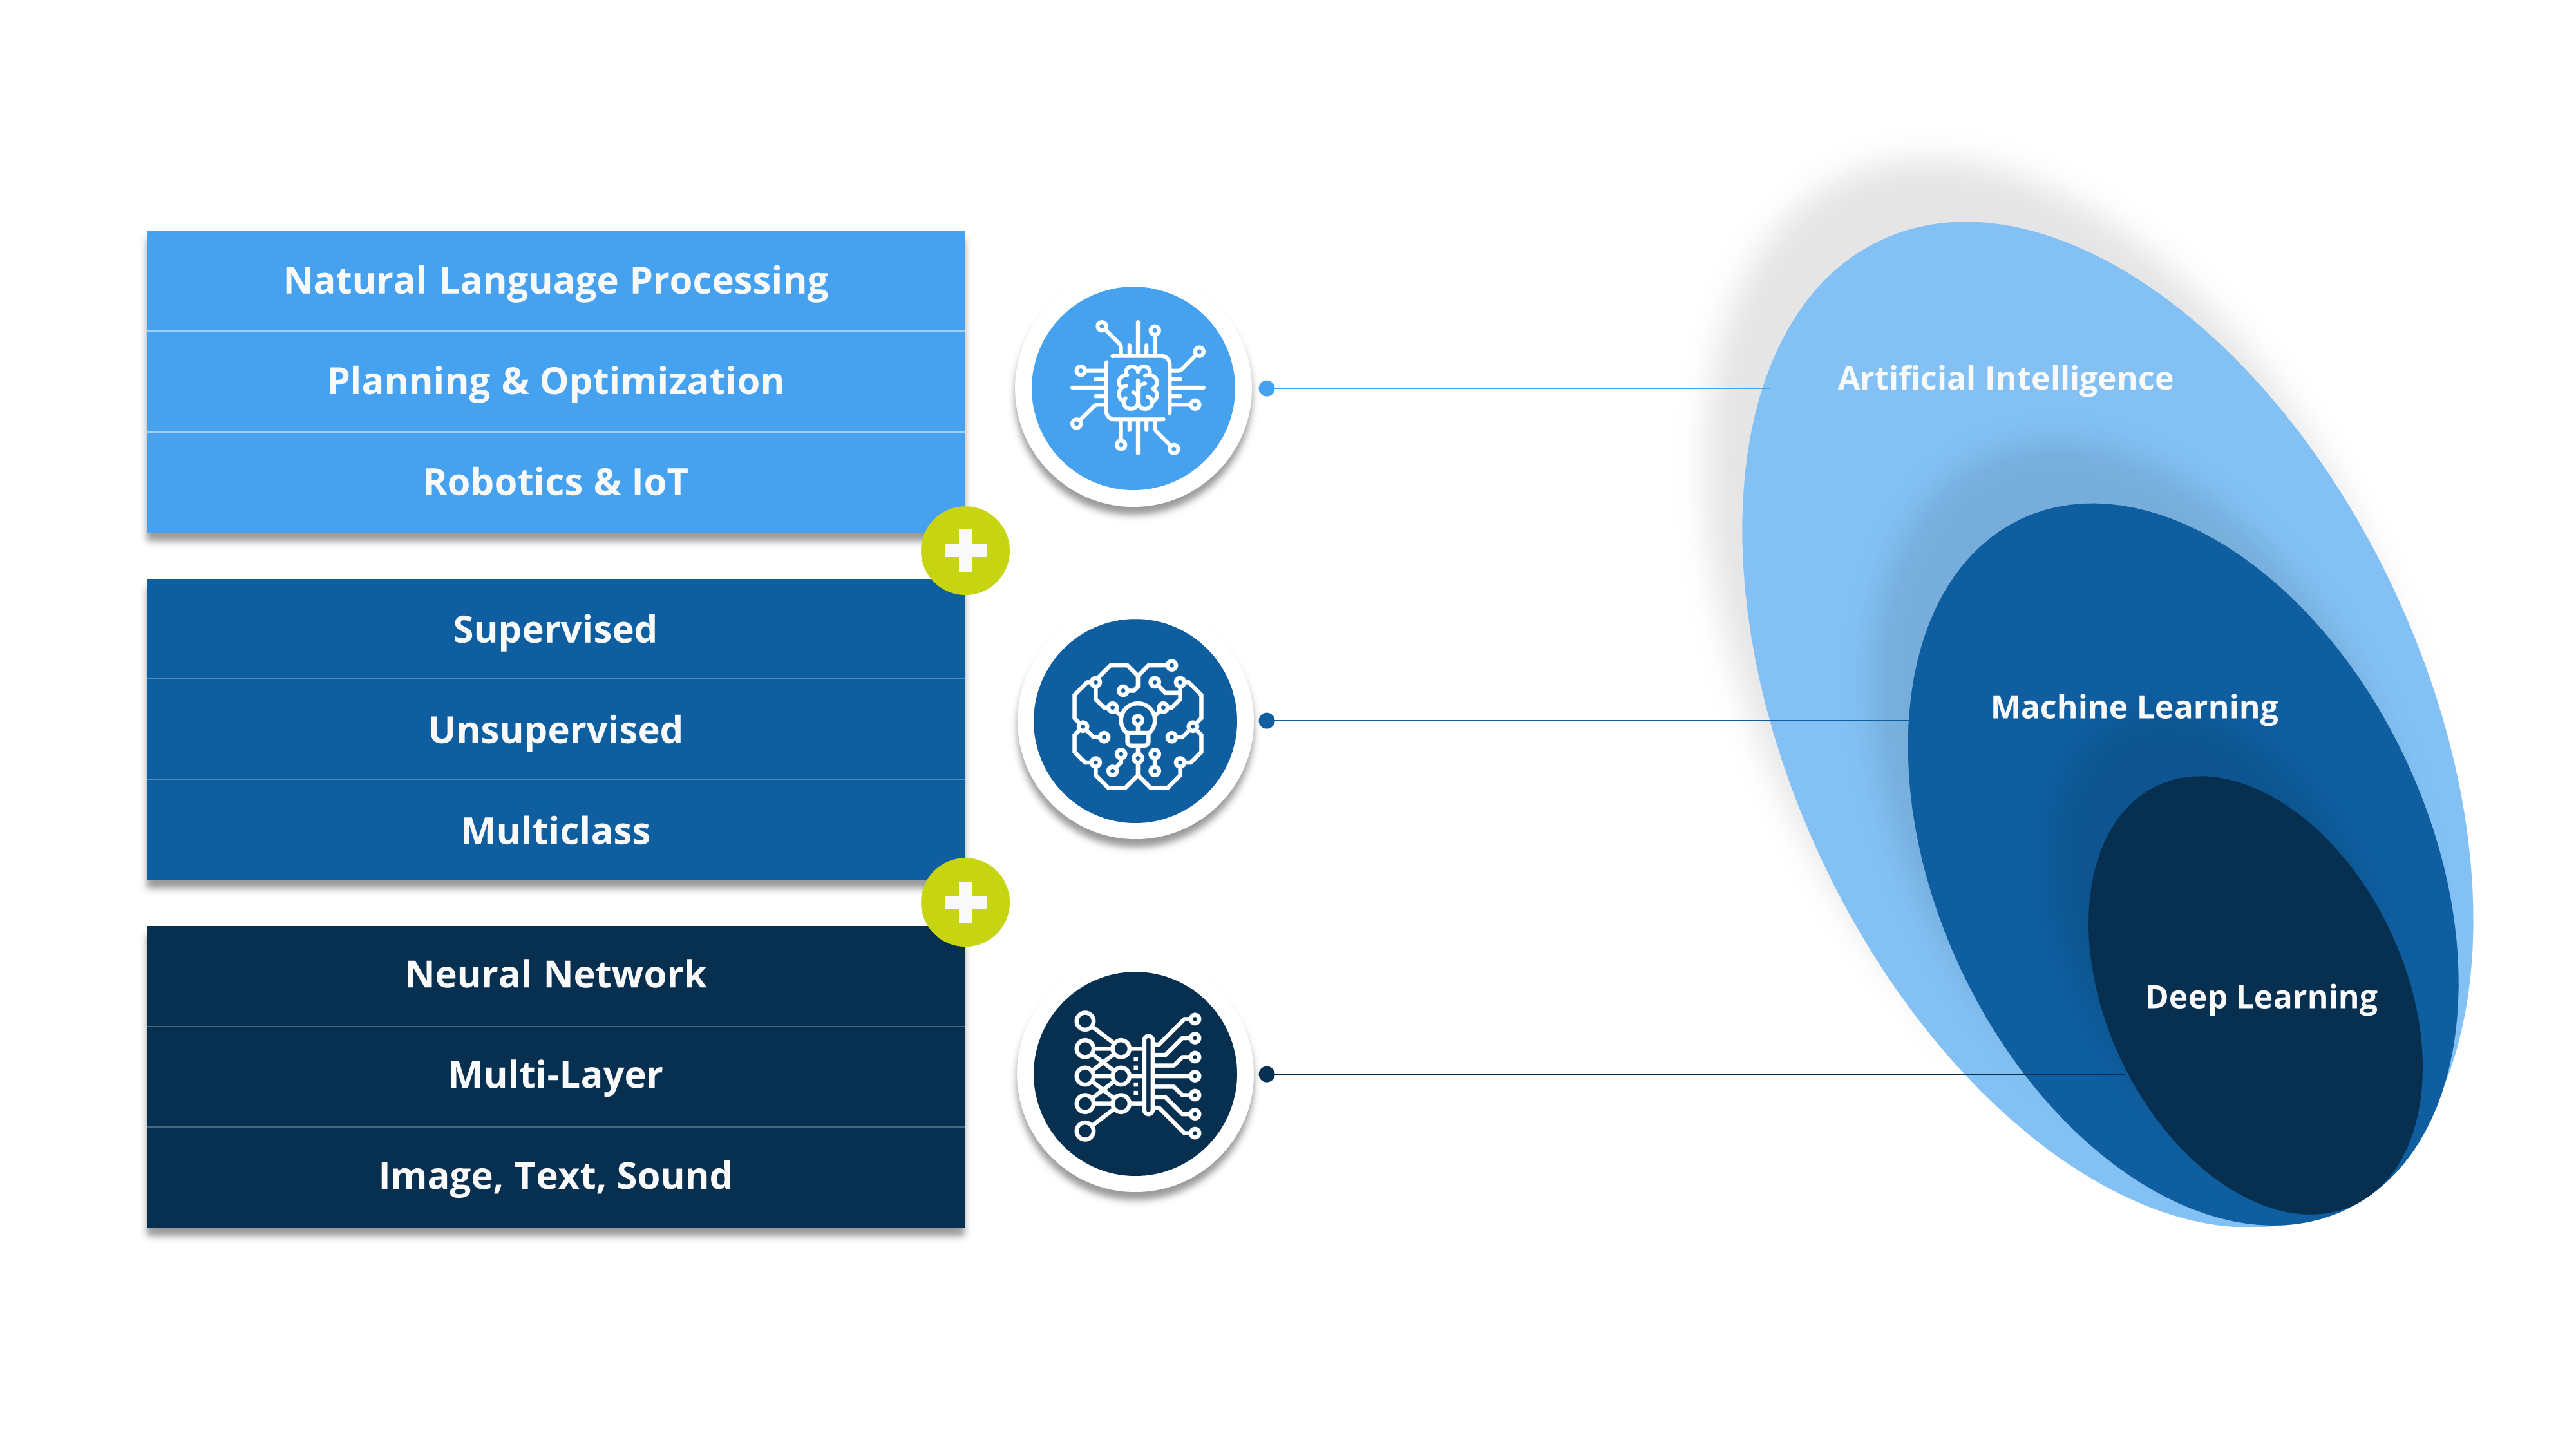
DATA SCIENCE MEETS BUSINESS INTELLIGENCE
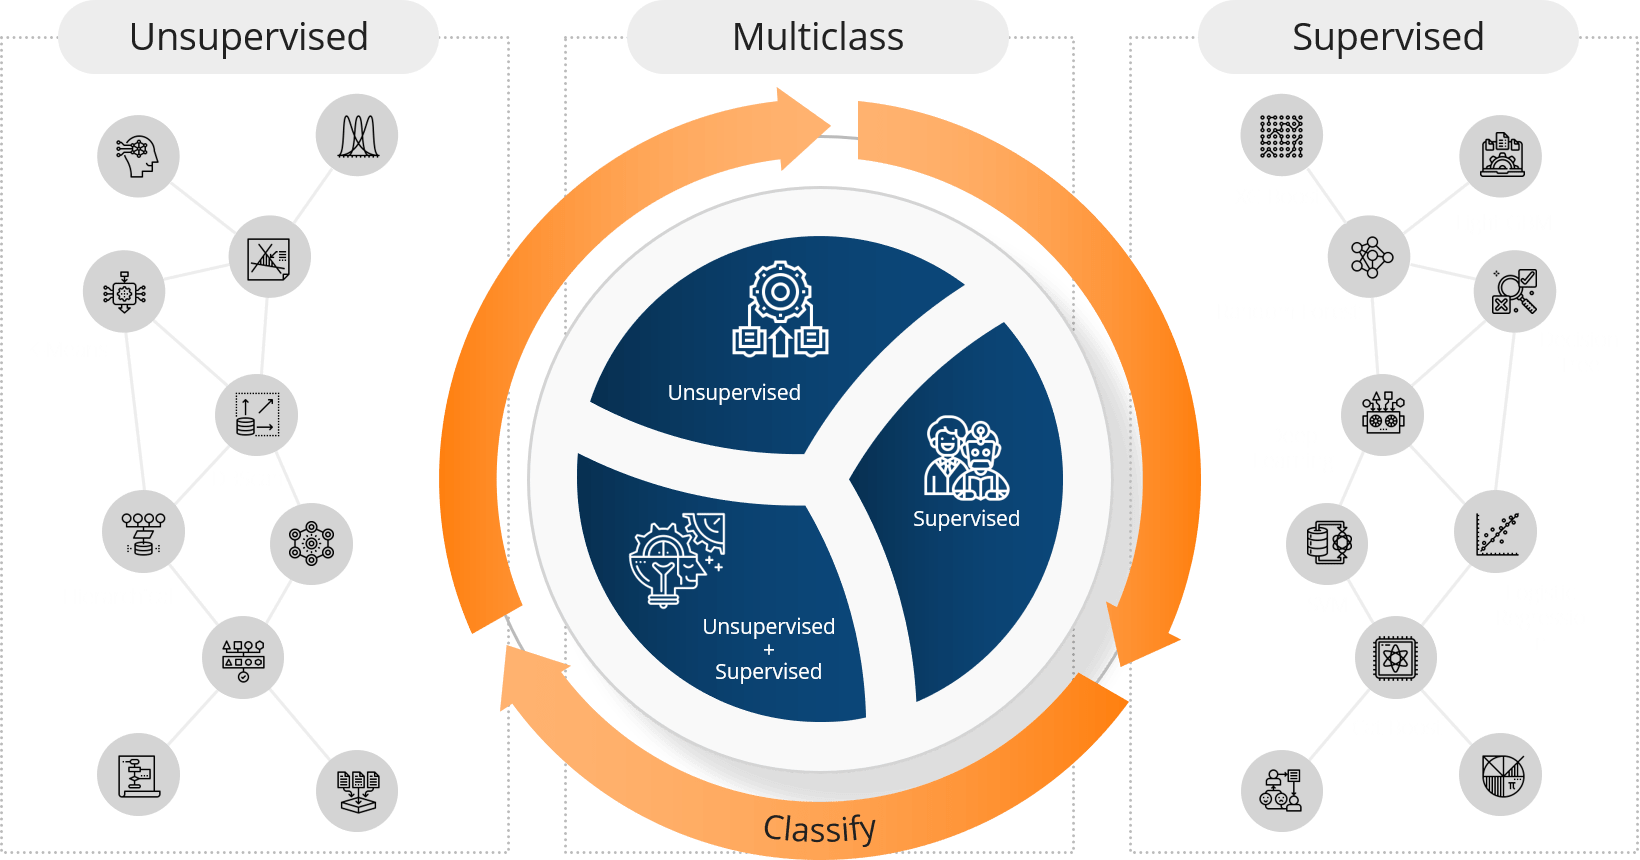
Artificial Intelligence and Machine Learning are the most aspirational technologies which one would like to implement in an organization but very few know what it implies and how to implement. OpenBI has the understanding of client’s business problem statement and know-how of prescribing the best suited AI/ ML solutions which are effective and realistic to implement.
AUTOMATED CLASSIFICATIONS
One of the most classic problem faced by organizations is classifying items into custom taxonomy due to poor data feed/ collection. OpenBI’s proprietary AI based classification algorithm helps customers in classifying records with high level of accuracy which finds great application in finance, procurement & supply chain, HR analytics, sales & marketing and many more.
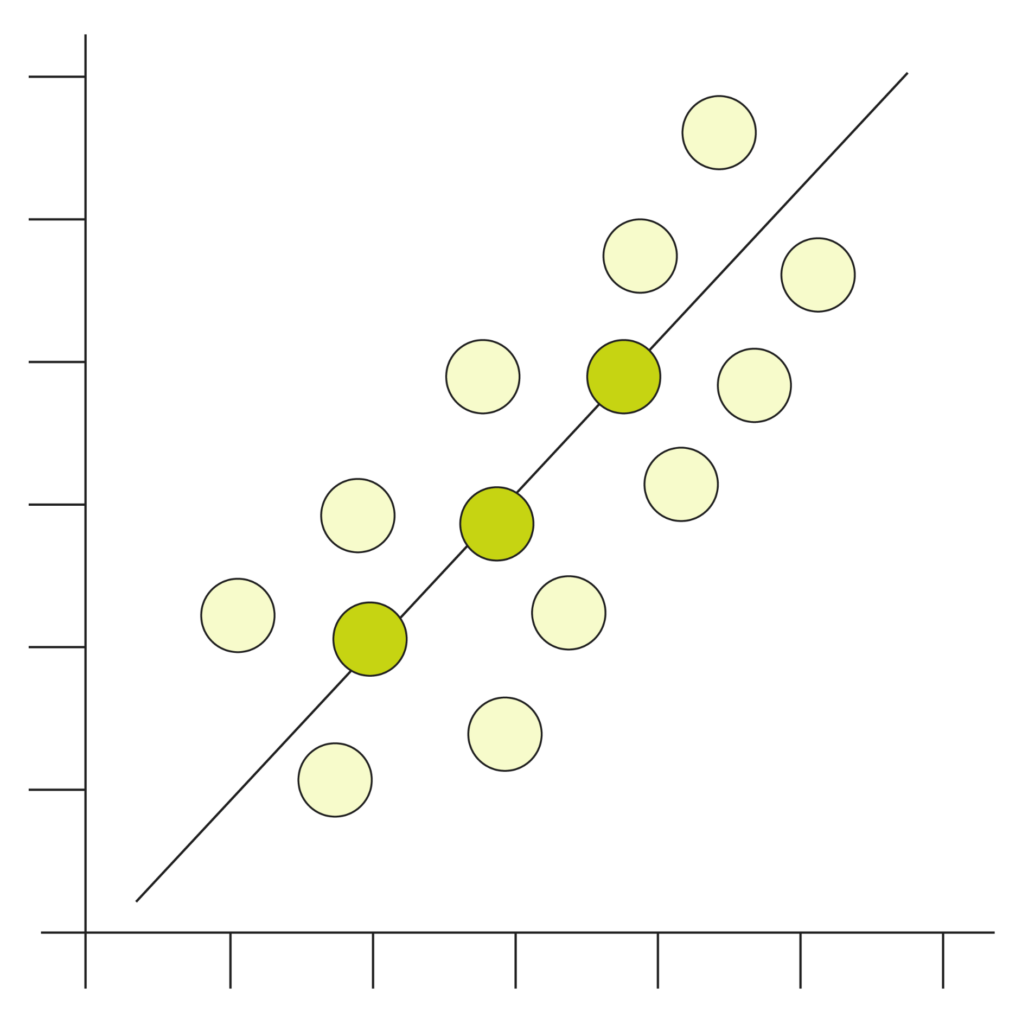
Regression
Regression is a statistical method used in finance, investing, and other disciplines that attempt to determine the strength and character of the relationship between one dependent variable (usually denoted by Y) and a series of other variables (known as independent variables)
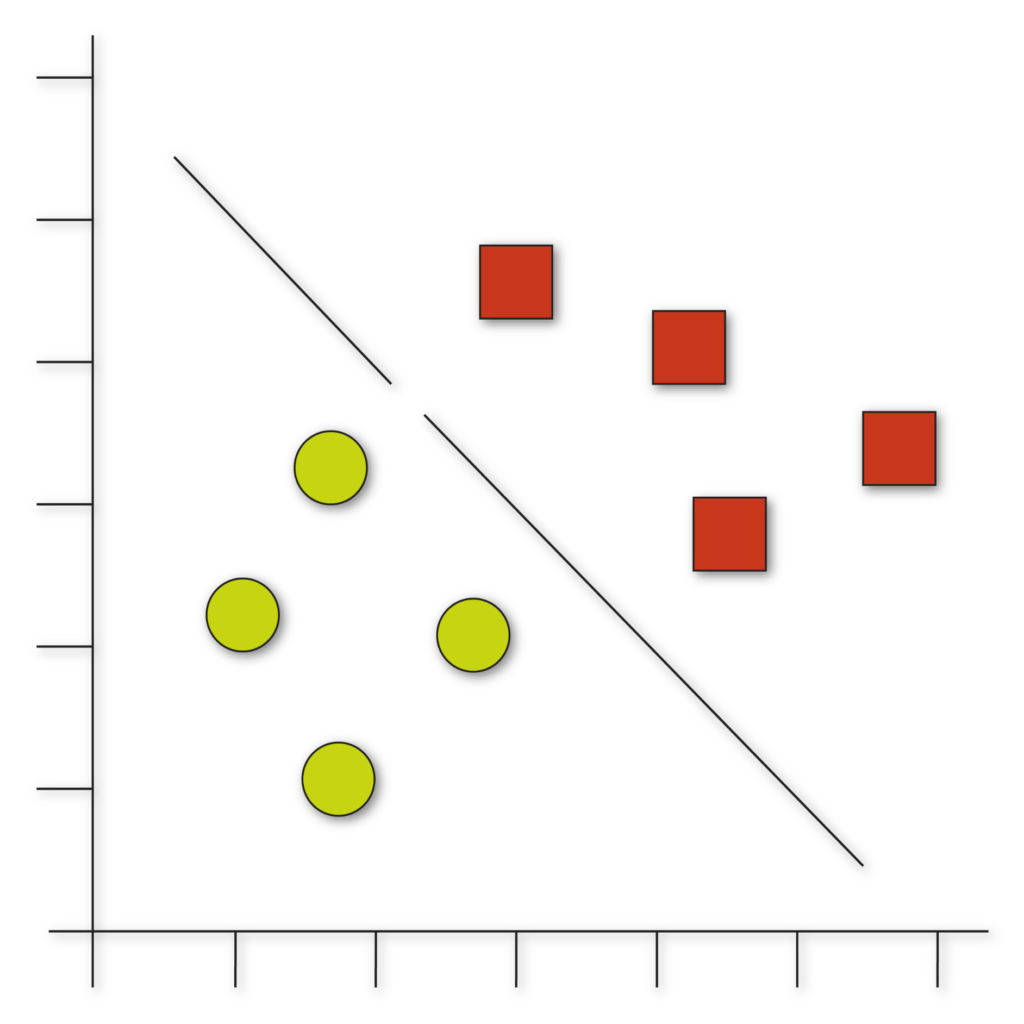
Classification
Classification refers to a predictive modeling problem where a class label is predicted for a given example of input data. Examples of classification problems include: Given an example, classify if it is spam or not. Given a handwritten character, classify it as one of the known characters.
Clustering
Clustering is the task of dividing the population or data points into a number of groups such that data points in the same groups are more similar to other data points in the same group than those in other groups. In simple words, the aim is to segregate groups with similar traits and assign them into clusters.
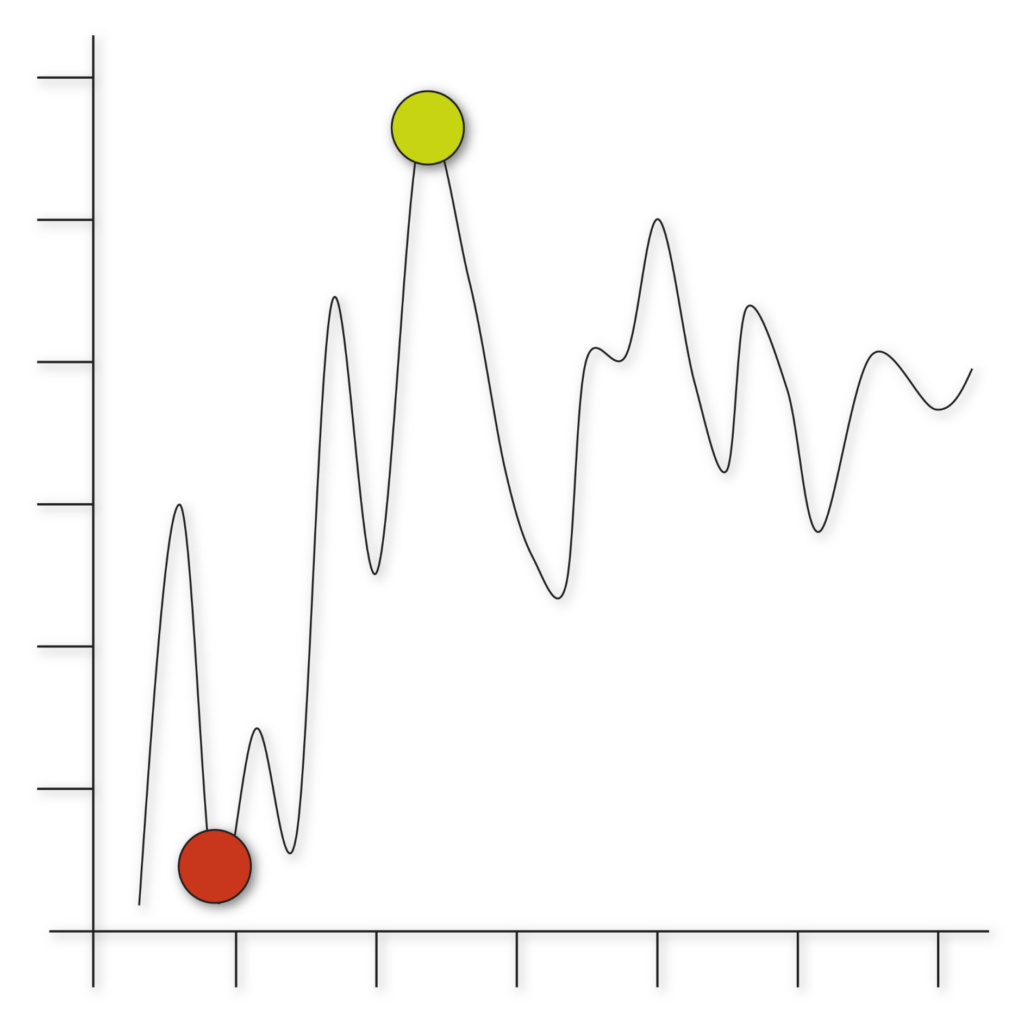
Anomaly detection
Anomaly detection (aka outlier analysis) is a step in data mining that identifies data points, events, and/or observations that deviate from a dataset’s normal behavior. Anomalous data can indicate critical incidents, such as a technical glitch, or potential opportunities, for instance a change in consumer behavior.
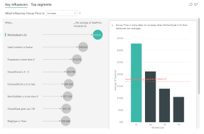
AI Visualizations
AI Visualizations use pre-coded machine learning or AI algorithms to visualize the data. The typical examples being decomposition trees, Key Influencers, AI Narratives, Ask a question, etc.
Sentiment Analysis
Sentiment analysis (also known as opinion mining or emotion AI) refers to the use of natural language processing, text analysis, computational linguistics, and biometrics to systematically identify, extract, quantify, and study affective states and subjective information.
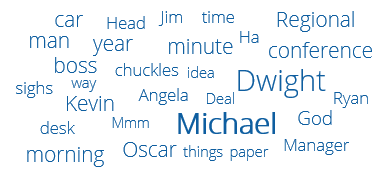
Key Phrase Analysis
Key Phrase Analysis is the process of analyzing the keywords or search phrases within a cluster of text. A keyword analysis is the starting point and cornerstone of search marketing campaigns.
TEXT translations
Text Translations is a common use case when data comes from multiple countries. OpenBI provides seamless integration with text translation API’s to not only convert your text in required language but also detect the language