PROVIDING RIGHT DATA AT THE RIGHT TIME TO THE RIGHT PEOPLE
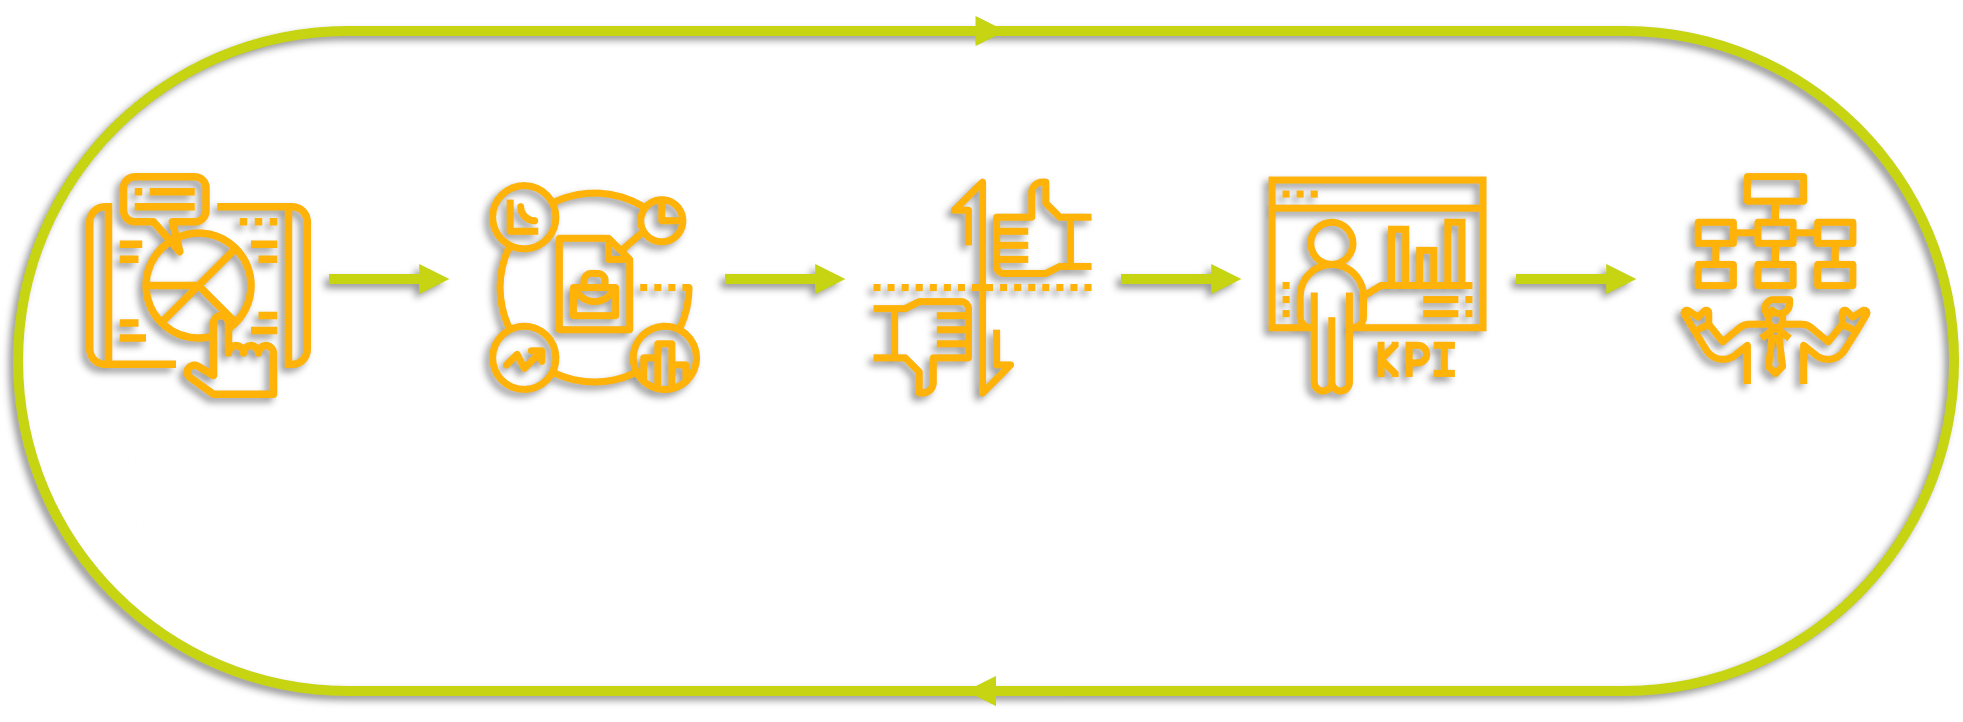
BUSINESS INTELLIGENCE ROADMAP
Organizations often rely on internal data for benchmarking and reporting; however, lack of external market intelligence downplays the strategy. Marrying internal data with external intelligence provides actionable insights which leads to effective strategy making.
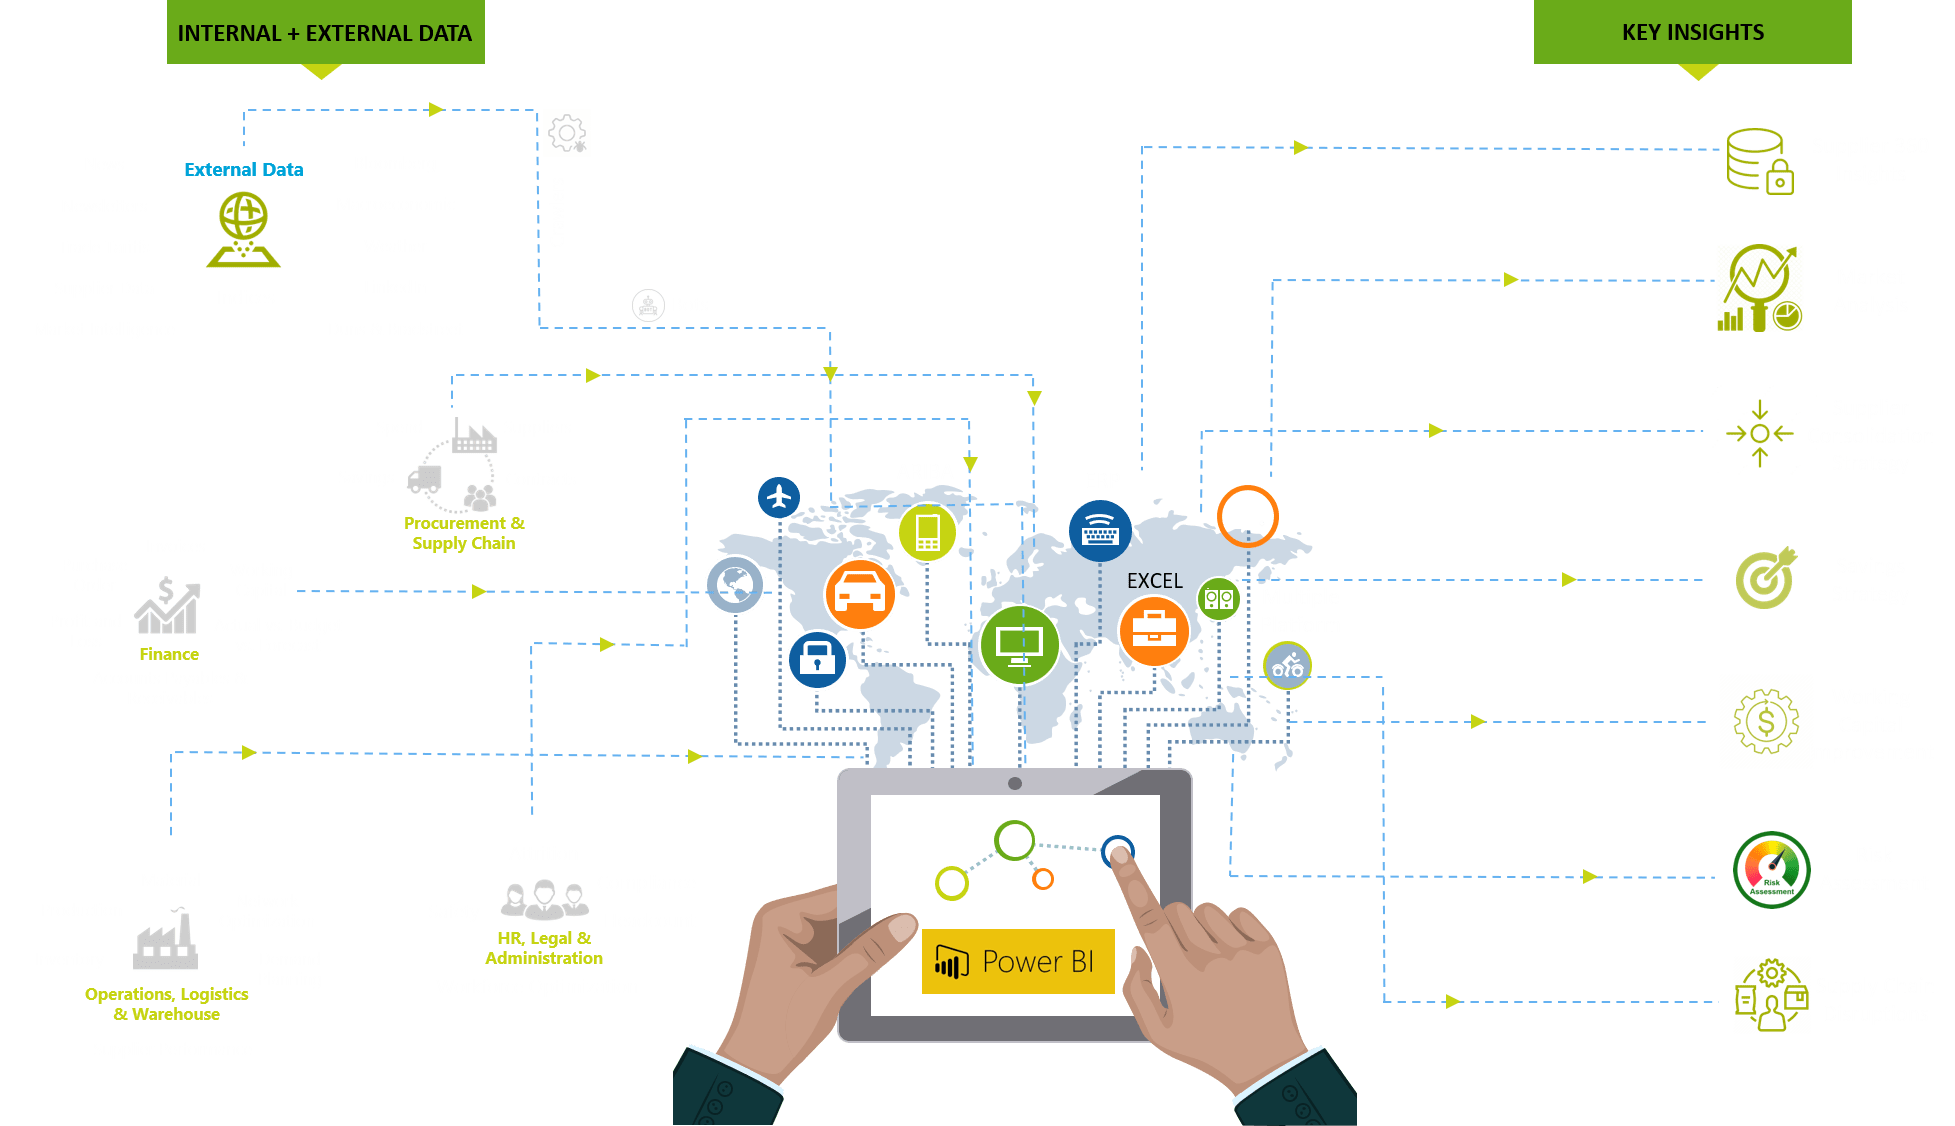
CONNECTED DATA
Data in an organization is like blood flowing through veins. Power BI is the heart which pumps the data from different sources and provides key actionable insights to business users.
Internal + External
Enriching internal data with external inputs to provide actionable insights
Supply Chain
Connected insights across spend, savings, suppliers, contracts, market prices etc.
Finance
Connected insights across invoices, purchase order, Working capital, PnL, etc.
Manufacturing
Connected insights across production, demand plan, inventory, performance, etc.
HR & Legal
Connected insights across attrition, compliance, headcount, workforce, etc
MANAGEMENT PRESENTATIONS
An effective presentation is a key to successful meetings. Business stakeholders are loaded with ideas and strategy but lack time to effectively carve out the aesthetics. OpenBI helps our customers to convert management presentation to a visual treat thereby saving them time and landing great presentations.
Business Presentations
Business Presentations
COVID19 LIVE TRACKER
An effective tool to track global COVID-19 infections to gain critical insights on countries with highest growth of infections as well as policy measures and border closure status.
Click the ⤢ icon at the bottom-right of the report page to enjoy the full-screen view:
EASE OF DOING BUSINESS 2020
Analysis of ease of doing business data of 180 countries released by world bank. This showcases how 600+ slides of information can be compressed to one single dashboard for ease of data consumption and interpretation.
Click the ⤢ icon at the bottom-right of the report page to enjoy the full-screen view: