LAST STEP OF SUCCESSFUL DATA DRIVEN ANALYTICS STRATEGY
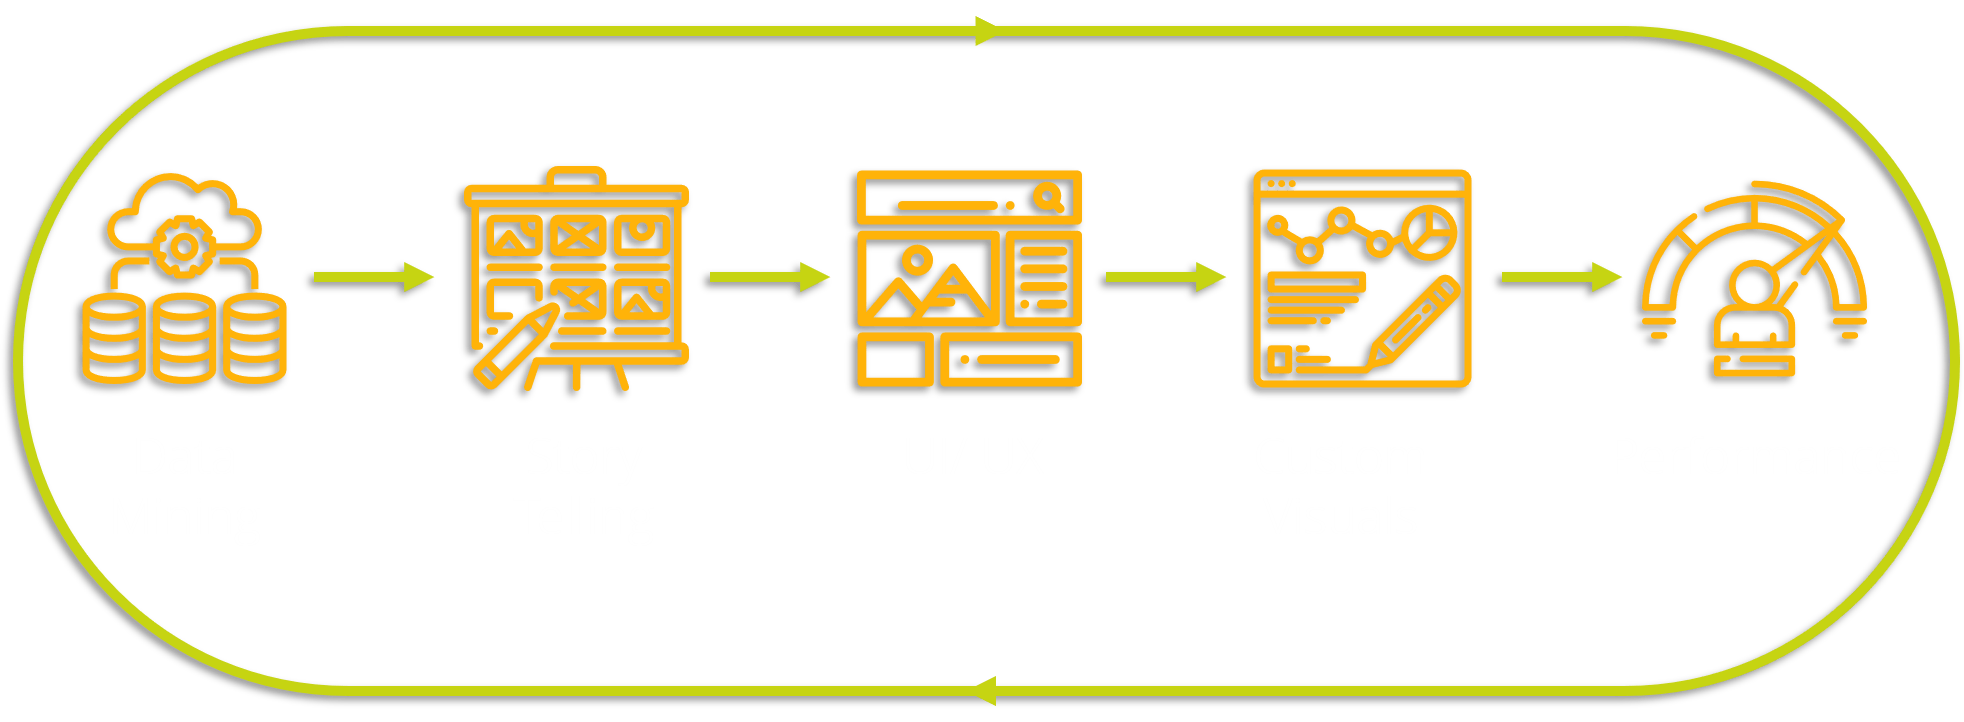
DATA VISUALIZATION ROADMAP
Effective data visualization helps organizations corelate the storyline behind their data which drives meaningful insights. This journey does not only equate to graphs but also showcases the art of story telling, art of visualization possibilities, defining apt UI/ UX and monitoring report performance.
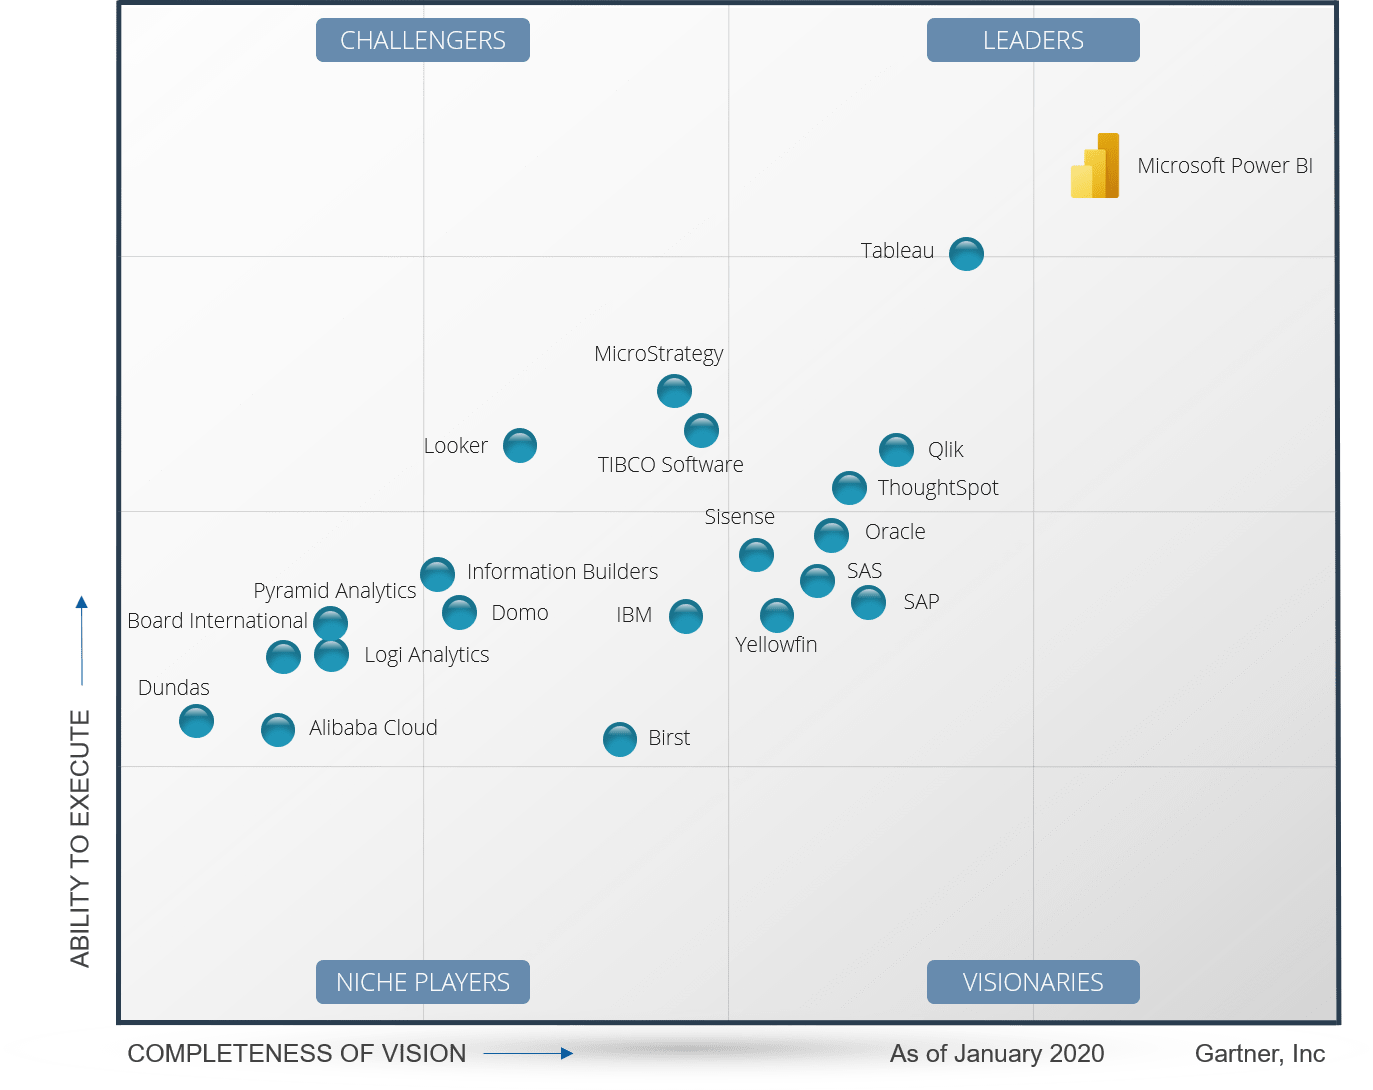
MICROSOFT POWER BI
When it comes to visualization, Gartner and Forrester rank Microsoft’s Power BI as the market leader. OpenBI has high level of proficiency and excellence in Power BI to deliver world class visualization solutions.
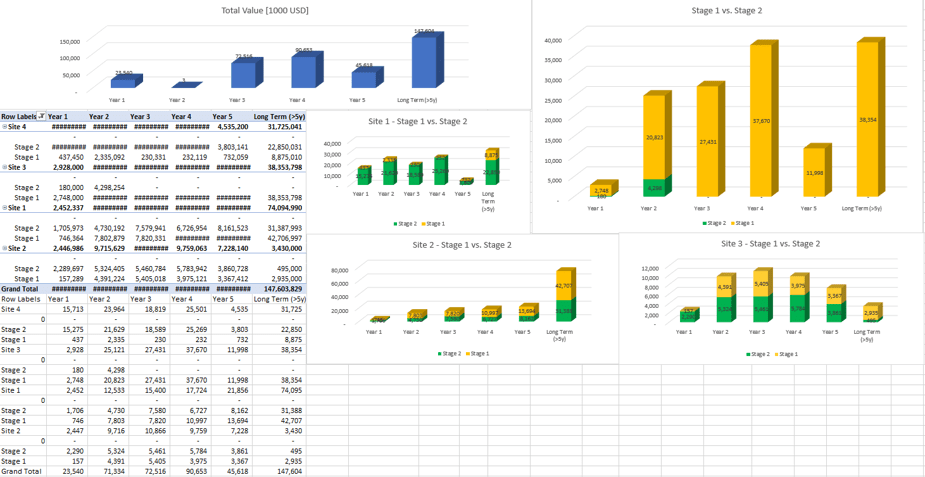
EXCEL TO POWER BI
Power BI is nothing but excel on steroids. It not only provides a tool-based output which makes it a single source of truth but also increases the adoption and consumption of business intelligence to the wider audience. It overcomes the excel bottlenecks and helps you slice and dice the data in a much more interactive and efficient manner.
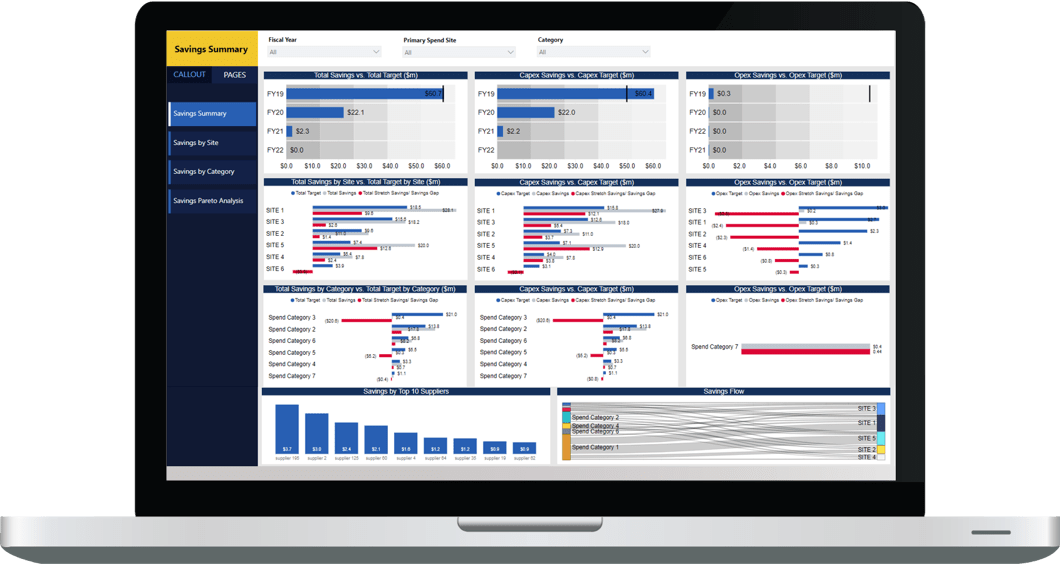
Excel dashboard
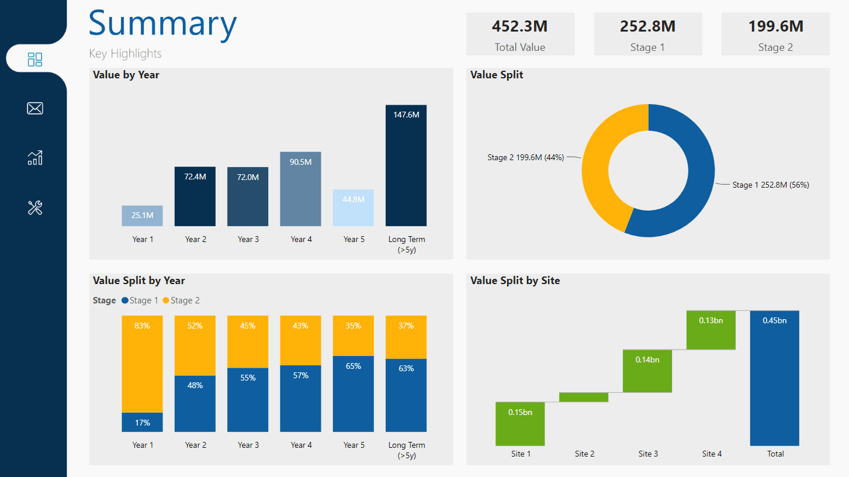
Power BI Dashboard
Cloud Sharing
Visualizations/ Dashboards which can be cloud shared within your organization
Single Source of Truth
Cloud sharing facilitates single source of truth thereby eliminating version issues
Automated Updates
Automated/ Scheduled refreshes for real time updates to make your model live
Scalable Technology
Unlike excel which has computation limitations, Power BI models can be scaled up to 100TB
Security
Maximum data security and compliance across regions with on-premises/ cloud options
ART OF VISUALIZATION POSSIBILITIES
Custom Power BI visualizations which can be used to formulate dashboards with endless possibilities.
Click the ⤢ icon at the bottom-right of the report page to enjoy the full-screen view:
A SIMPLE WAY TO DAZZLE YOUR DATA
Long gone are the days when excel or PowerPoint used to be the standard reporting platform. Using Power BI your data is always live and interactive.