Data Analytics & Visualization
Transforming Complex Data into Clear Visual Stories for Informed Decision-Making.
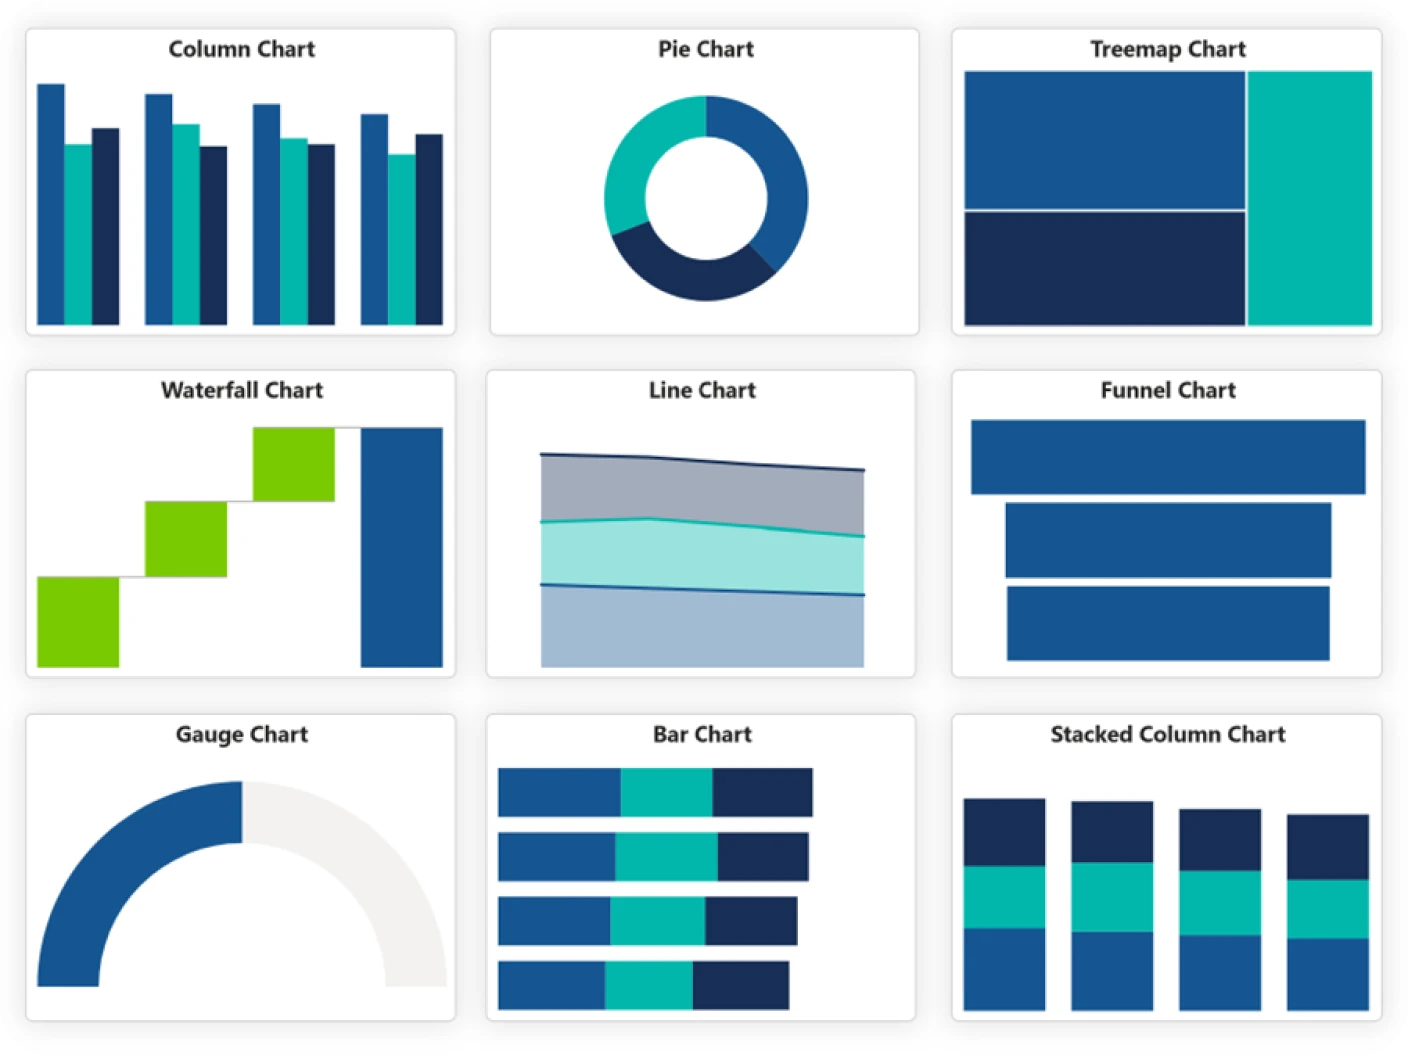
The Art of Story Telling with Power BI
Visualize Success Through Data-Driven Stories That Illuminate Trends and Influence Outcomes.
Story Telling
Automate repetitive tasks and workflows by triggering actions based on specific conditions or events. These flows run seamlessly in the background, eliminating manual effort and enhancing efficiency across business processes.
UI/ UX
Execute instant actions at the click of a button, enabling users to trigger workflows on demand. Ideal for quick approvals, notifications, or routine tasks, button flows provide real-time control and flexibility.
Actionable Insights
Convert complex data into actionable insights with Power BI. Our analytics drive data-driven decisions, providing you with clear, actionable information to respond swiftly to business challenges and opportunities.
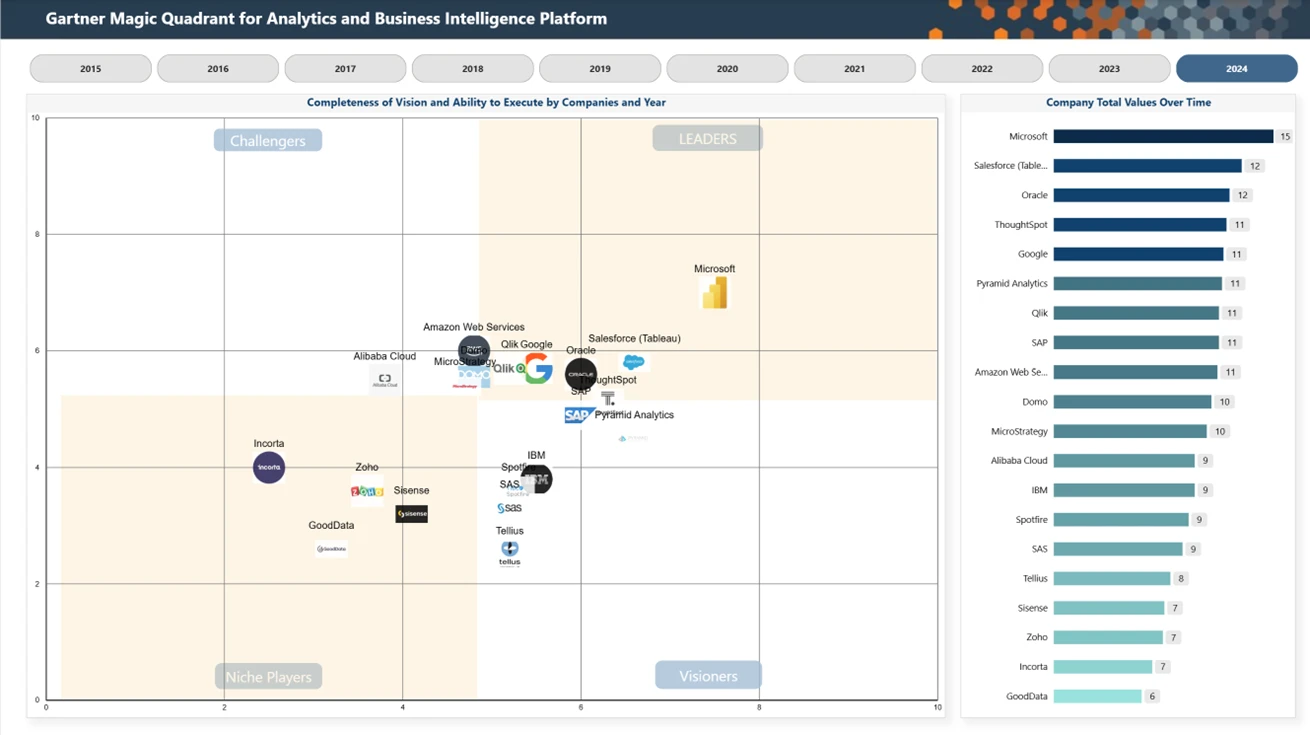
What Makes Power BI the Premier Choice in the Field of Data Analytics & Visualization?
According to Gartner, Power BI has consistently maintained its position as the market leader in the Analytics and Business Intelligence Platform sector for seventeen consecutive years.
Streamline Your Data with Superior UI/UX Design
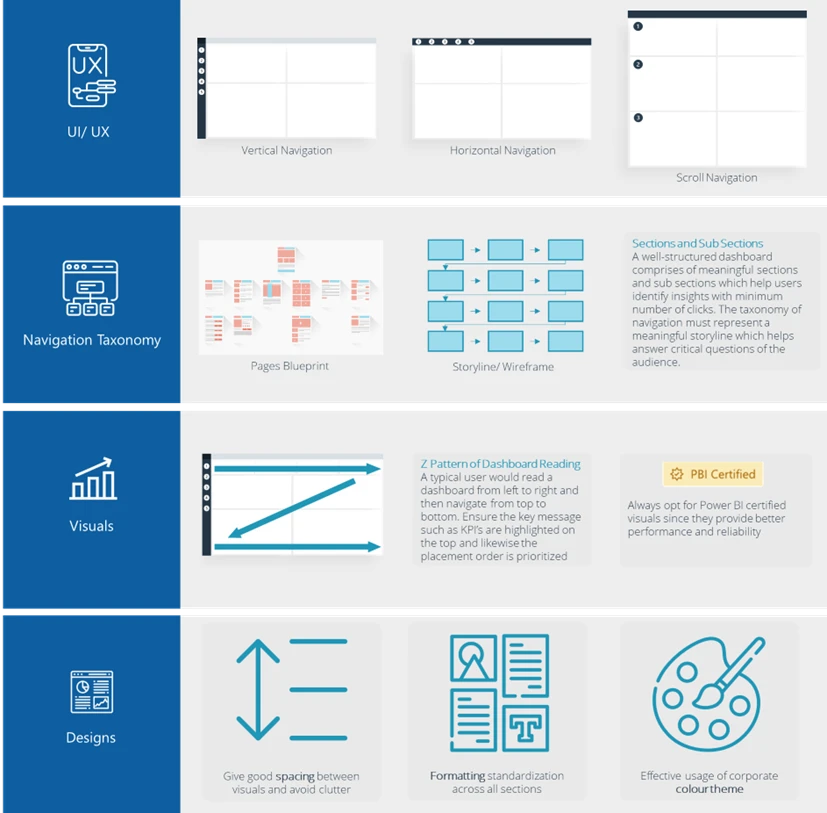
Clear Insights, Clean Design
At OpenBI, we specialize in crafting intuitive and visually engaging data visualization interfaces. Our approach integrates seamless navigation options—vertical, horizontal, and scroll—along with strategic layout designs like the Z-pattern to enhance the natural viewing flow. We prioritize clarity with well-structured dashboards certified by Power BI, ensuring key insights stand out effortlessly. With consistent formatting and a cohesive color theme, we transform complex data into clear, actionable insights that foster informed decision-making.
Customer Feedback
A multinational Pharmaceutical company collaborates with OpenBI for Data Analytics & Visualization.
OpenBI has transformed our pharmaceutical operations by enhancing financial strategies and operational efficiencies with their Power BI solutions. Their tailored dashboards provide comprehensive insights into finance, plasma procurement, and unit cost analysis, which significantly improve our decision-making capabilities. OpenBI’s tools also enable us to effectively manage our sustainability initiatives, optimize resource allocation, and streamline vendor alliance management. This holistic approach empowers us with the agility and precision necessary to navigate the complexities of the competitive pharmaceutical market, ensuring we maintain a leading edge.
Global Finance Manager - Pharmaceutical

A Leader in Oncology Vaccines Partners with OpenBI for Enhanced Financial Analytics & Visualization.
Collaborating with OpenBI has revolutionized our approach to financial management within the oncology vaccine sector. Their Power BI solutions have been instrumental in refining our financial strategies through advanced analytics and dynamic visualizations. OpenBI's custom dashboards provide us with detailed insights into our financial performance, enabling precise comparisons between actual spending, budget allocations, and financial forecasts. This level of clarity has significantly enhanced our ability to make informed financial decisions quickly and accurately. Furthermore, OpenBI’s comprehensive tools have streamlined our financial reporting processes, facilitating better resource allocation and strategic planning. Their expertise in handling complex data ensures that we can navigate the intricacies of the competitive oncology market with confidence and maintain our position at the forefront of innovation.
Global Finance Director - Oncology Vaccines Division

Leading Commercial Cargo Airline Elevates Operations with OpenBI's Data Analytics & Visualization.
OpenBI's expertise in data analytics and visualization has brought a transformative change to our operations. Their Power BI solutions have deeply integrated into our core functions, providing extensive insights into flight and cargo data which have optimized our logistics and operational efficiencies. The visualizations enable us to monitor real-time cargo capacities and flight schedules, improving our service delivery and operational responsiveness. OpenBI’s analysis of our financial and employee data has also been pivotal. By aligning our financial strategies and workforce management with actual operational data, we have enhanced profitability and employee productivity. These improvements have allowed us to make faster, data-driven decisions, reducing costs and enhancing our competitive edge in the global market.
Chief Operations Officer - Commercial Cargo Airline